
Company: Bank of America (sponsoring Master’s Capstone Project)
Duration: 8 months
Role: UX Design & Research
Team:
5 CMU Masters students
Overview
This was the capstone project for CMU's MHCI program over the course of eight months. I worked with an interdisciplinary team of five MHCI students to explore financial decision making in the realm of personal banking. My primary role was as a UX Engineer, but included UX research and design as well.
Purpose
We set our sights on finding ways to enable mass affluent Bank of America customers to make better, more informed financial decisions. Ultimately, we found a series of tensions in the ways people approach their financial choices. Balancing values with actions is difficult, and the motivation necessary to make the best possible choices can be hard to find. While individual definitions may vary, we found that trust, simplicity, and control are key.
Our Approach
To help Bank of America's customers maker better financial decisions, we sought to understand what constituted financial health and how trust, automation, and the recent recession affected people's openness to receiving help.
Our research began with a literature review of 24 academic articles and white papers, a competitive analysis of products aimed at helping people manage their finances, and exploration of intervention techniques in four analogous domains. Following our secondary research, we recruited 17 participants and conducted hour long interviews with each. Interviews included open-ended questions, directed storytelling, a card sorting activity, and a radar diagram activity followed by a short survey.


Secondary Research: Dissecting Decision Making
Our team conducted a literature review and exploratory research of both direct competitors as well as analogous domains in order to better understand the space of unhealthy decision making.
Our secondary research was driven by three guiding questions:
What influences decision making?
How and why do people make poor decisions, and what kinds of poor decisions do they make?
What motivates people to make better decisions?
Literature Review
Studying various domains through an extensive literature review helped us to gain an understanding of the human nature of the decision making process, and where it can go awry.
From our research, we aggregated 12 biases that play a role in influencing the errors people are prone to while making decisions:


Competitive Analysis
We studied the competition through the lens of managing both income and spending habits, and evaluated tools across domains of savings, investment, debt management, bill payment, and financial education. We found that small companies are taking the biggest risks with innovative financial technology and tools, and it is paying off. While the threat to large banks is small, they are driving higher expectations in the retail banking sector.

Chart from competitive analysis report
Key Takeaways
Existing tools do not treat finance as part of a holistic individual, but rather as a discrete fragment
A lot of information can be hard to process, so people often try to oversimplify their decisions
It is difficult to fully understand how actions in the present will affect the future
Existing tools often do not provide directly actionable information, or only provide a limited set of options
Primary Research
Our team conducted interviews interspersed with structured activities to better understand where people obtain financial information and how trust influences decision making.

INTERVIEWS
We used a flexible structure of both questions and activities, to help build rapport and keep participants engaged. This also allowed us to improvise and cater to the communication style of each participant. Participants were recruited from a range of locations, ages, and income brackets. I wrote the script used in all 17 interviews and lead 3 interviews.

CARD SORTING ACTIVITY
We also conducted an open card sort, where participants arranged a set of pre-made cards into groups of their choosing and labeled them. As they explained why they chose to group different items together, we found insight into the ways finance fit with other components of their lives. I designed the digital version of this activity used in remote interviews.

RADAR DIAGRAMMING ACTIVITY
In an activity titled What’s On Your Radar?, participants generated sticky notes to illustrate where they turn for financial knowledge, advice, and assistance. The closer these notes were placed to the center of the chart, the more important they were to that individual. I designed the digital version of this activity used in remote interviews.

GUERRILLA RESEARCH
We spoke with passersby on a busy retail street in Pittsburgh about their sources of financial literacy and assistance. We later recruited two of these passersby for full-length interviews. I was responsible for guiding participants through the activity once they had agreed to participate.
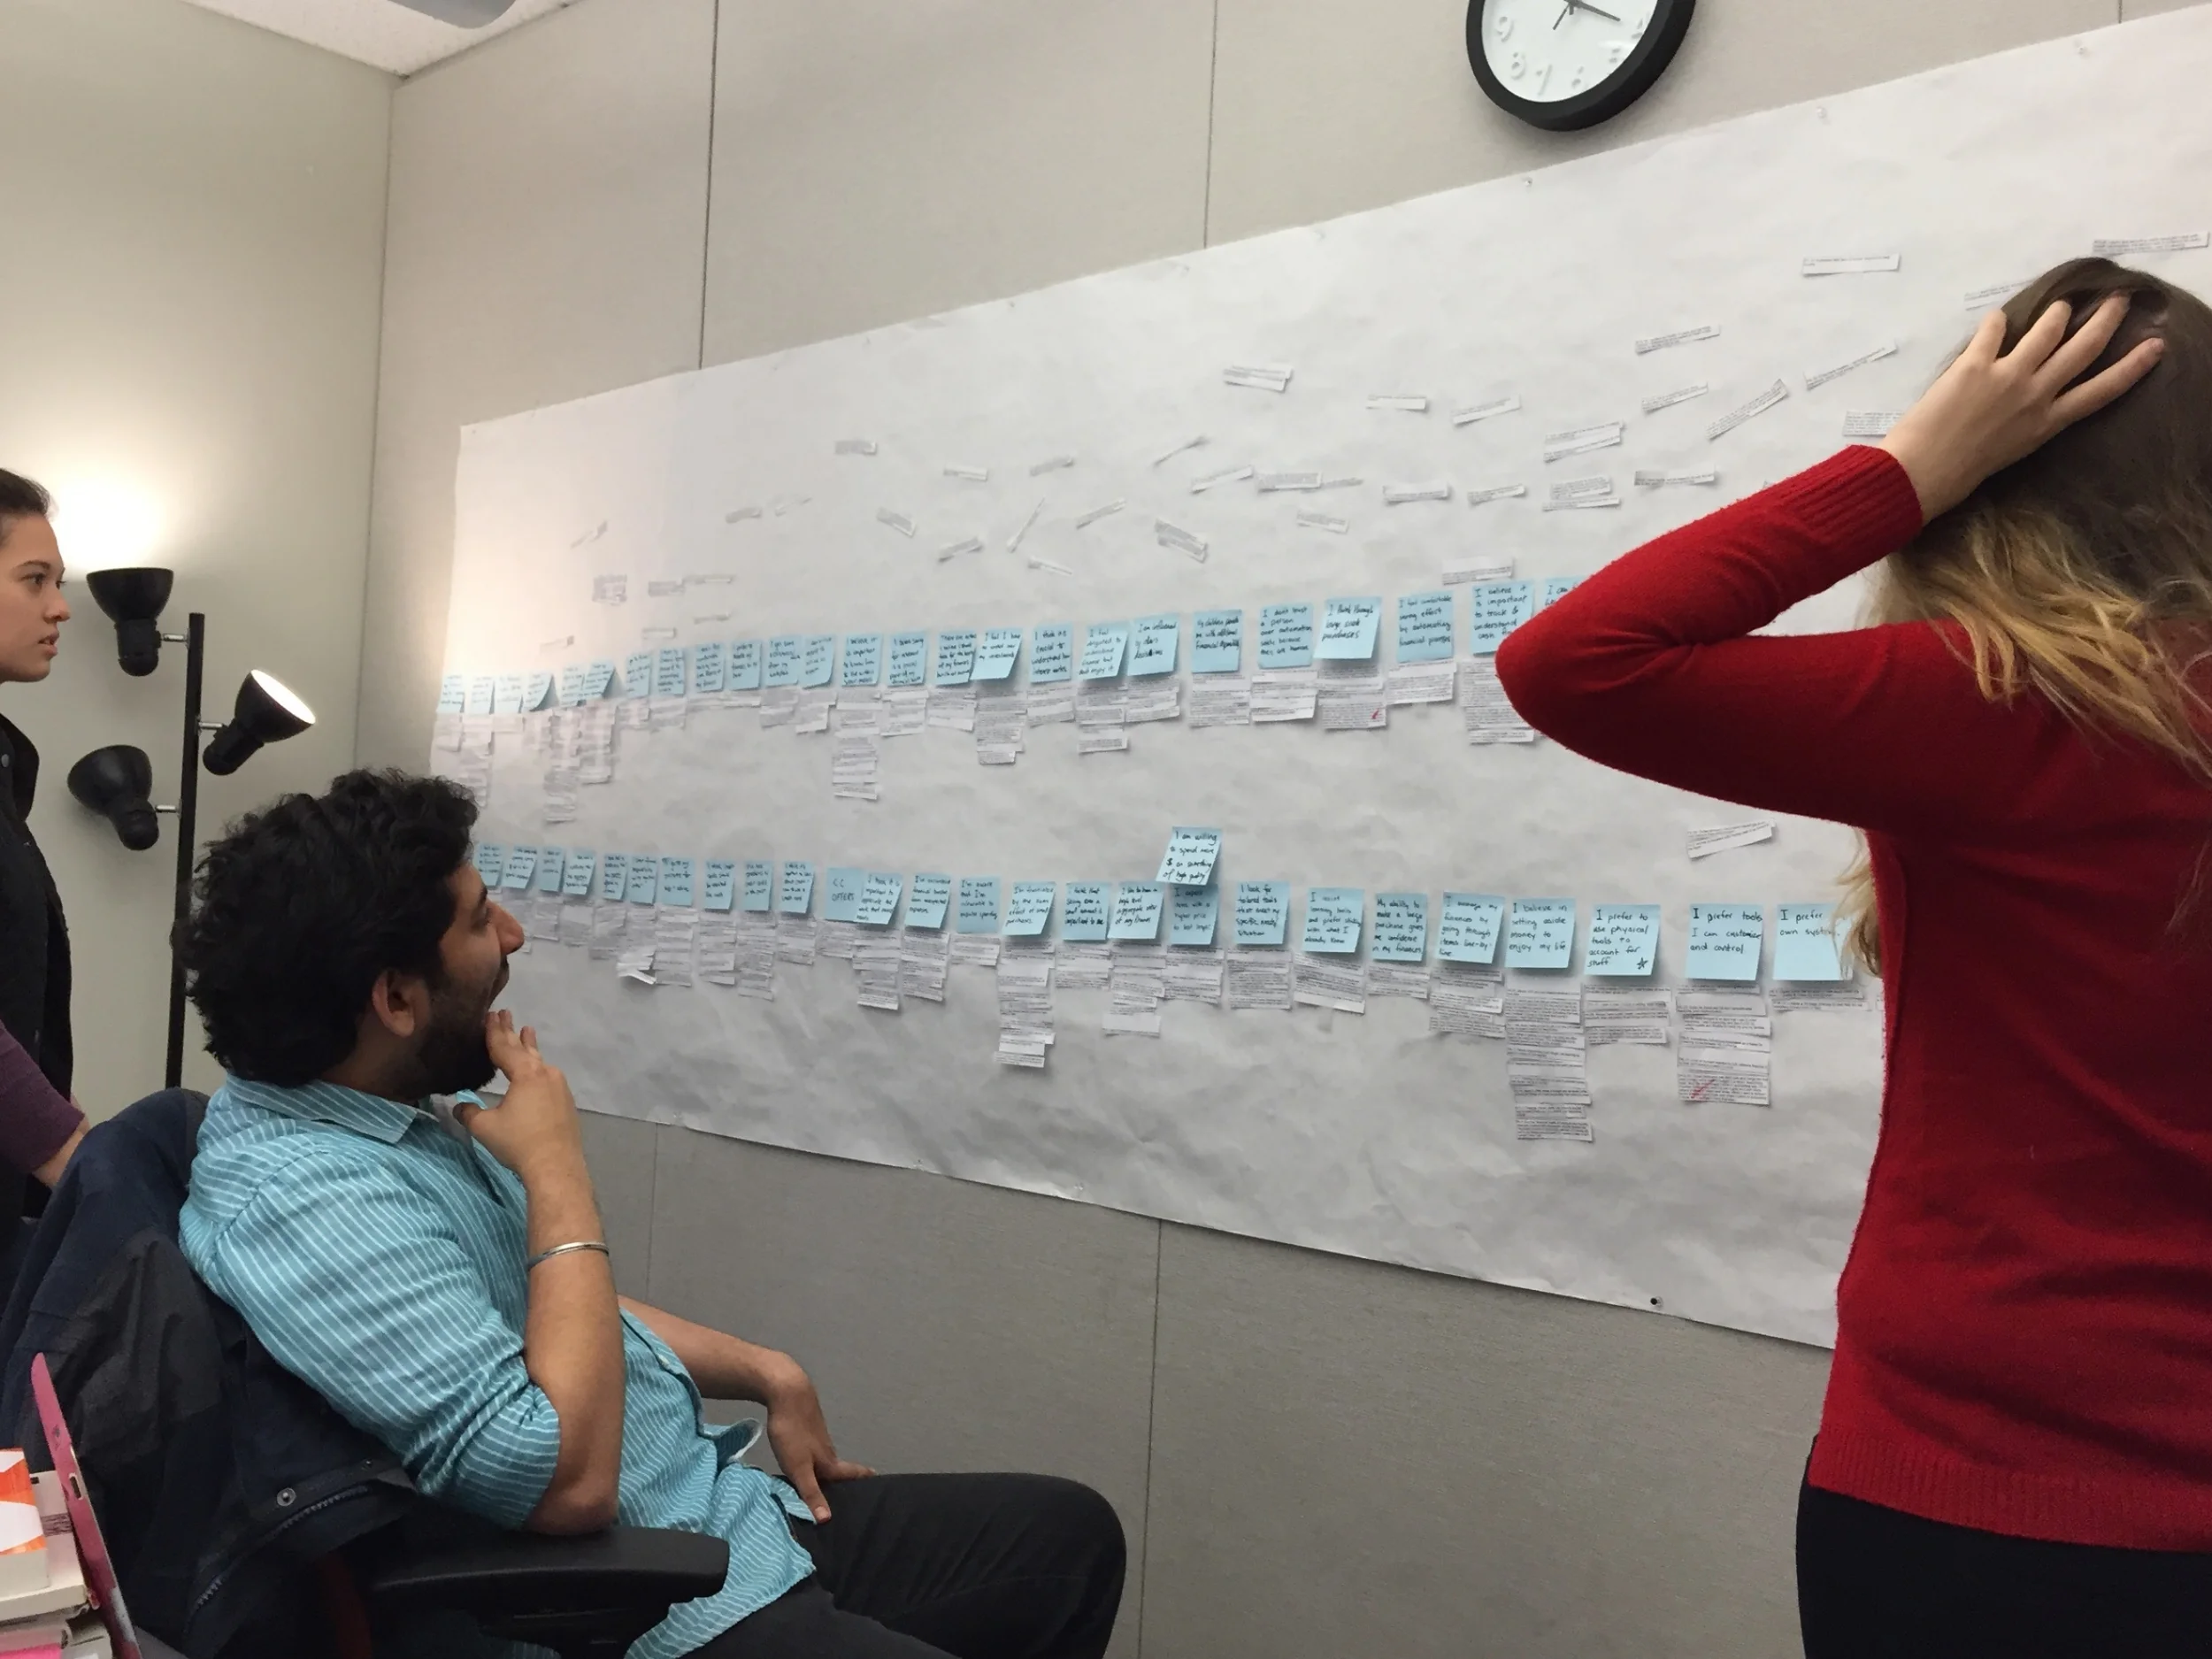
AFFINITY DIAGRAM ANALYSIS
We sorted and grouped over six hundred notes in an affinity diagram to find patterns throughout the interviews we conducted. Grouping these patterns led to over eighty separate insights into the financial mindsets and situations of our target population. Further abstracting these insights and focusing on the most powerful and impactful items led us to derive a series of key themes as one method of organizing our findings.
Key Insights: Tensions in Financial Values
As themes emerged from our affinity diagram analysis, our team noticed that many insights within these themes were in direct conflict with one another. These conflicts led us to additionally organize our findings by way of a series of powerful tensions, both internally to a single individual, and externally among different groups within our target demographic population.
External Tensions: External tensions result from opposing knowledge, values, and behaviors between separate subgroups within our participant pool. These external tensions are important to consider because they play a role mediating between different perspectives and values within the population as a whole. Key tensions we observed included:
“I don’t want to think about it” ↔️ “I manage my finances line by line”
“I’m comfortable taking on debt” ↔️ “I’m proud to have debt”
“My house is my primary investment” ↔️ “I had a financial crisis due to a house”
“I feel comfortable automating parts of my financial process” ↔️ “I am frustrated by losing track of automatic payments”
Internal Tensions: Internal tensions describe conflict resulting from incongruent knowledge, values, and behaviors within a single individual. These tensions were observed across genders, geographic locations, generations, and income levels. Many of these tensions were not directly acknowledged by participants but came about through our team’s affinity diagram analysis of the data. Key tensions we observed included:
“I want to feel in control” ↔️ “I don’t think my actions have impact”
“I believe saving is a key component of financial independence” ↔️ “There are actions I could take but I lack motivation”
“I value financial independence” ↔️ “I rely on my parents for financial help and advice”
“I seek financial stability through higher education” ↔️ “I sacrificed by taking on debt for higher education”
“I spend money on enjoyment” ↔️ “I’m frustrated by my spending habits”
“I consider my financial mistakes an important source of learning” ↔️ “I carefully consider larger purchases to avoid regrets”
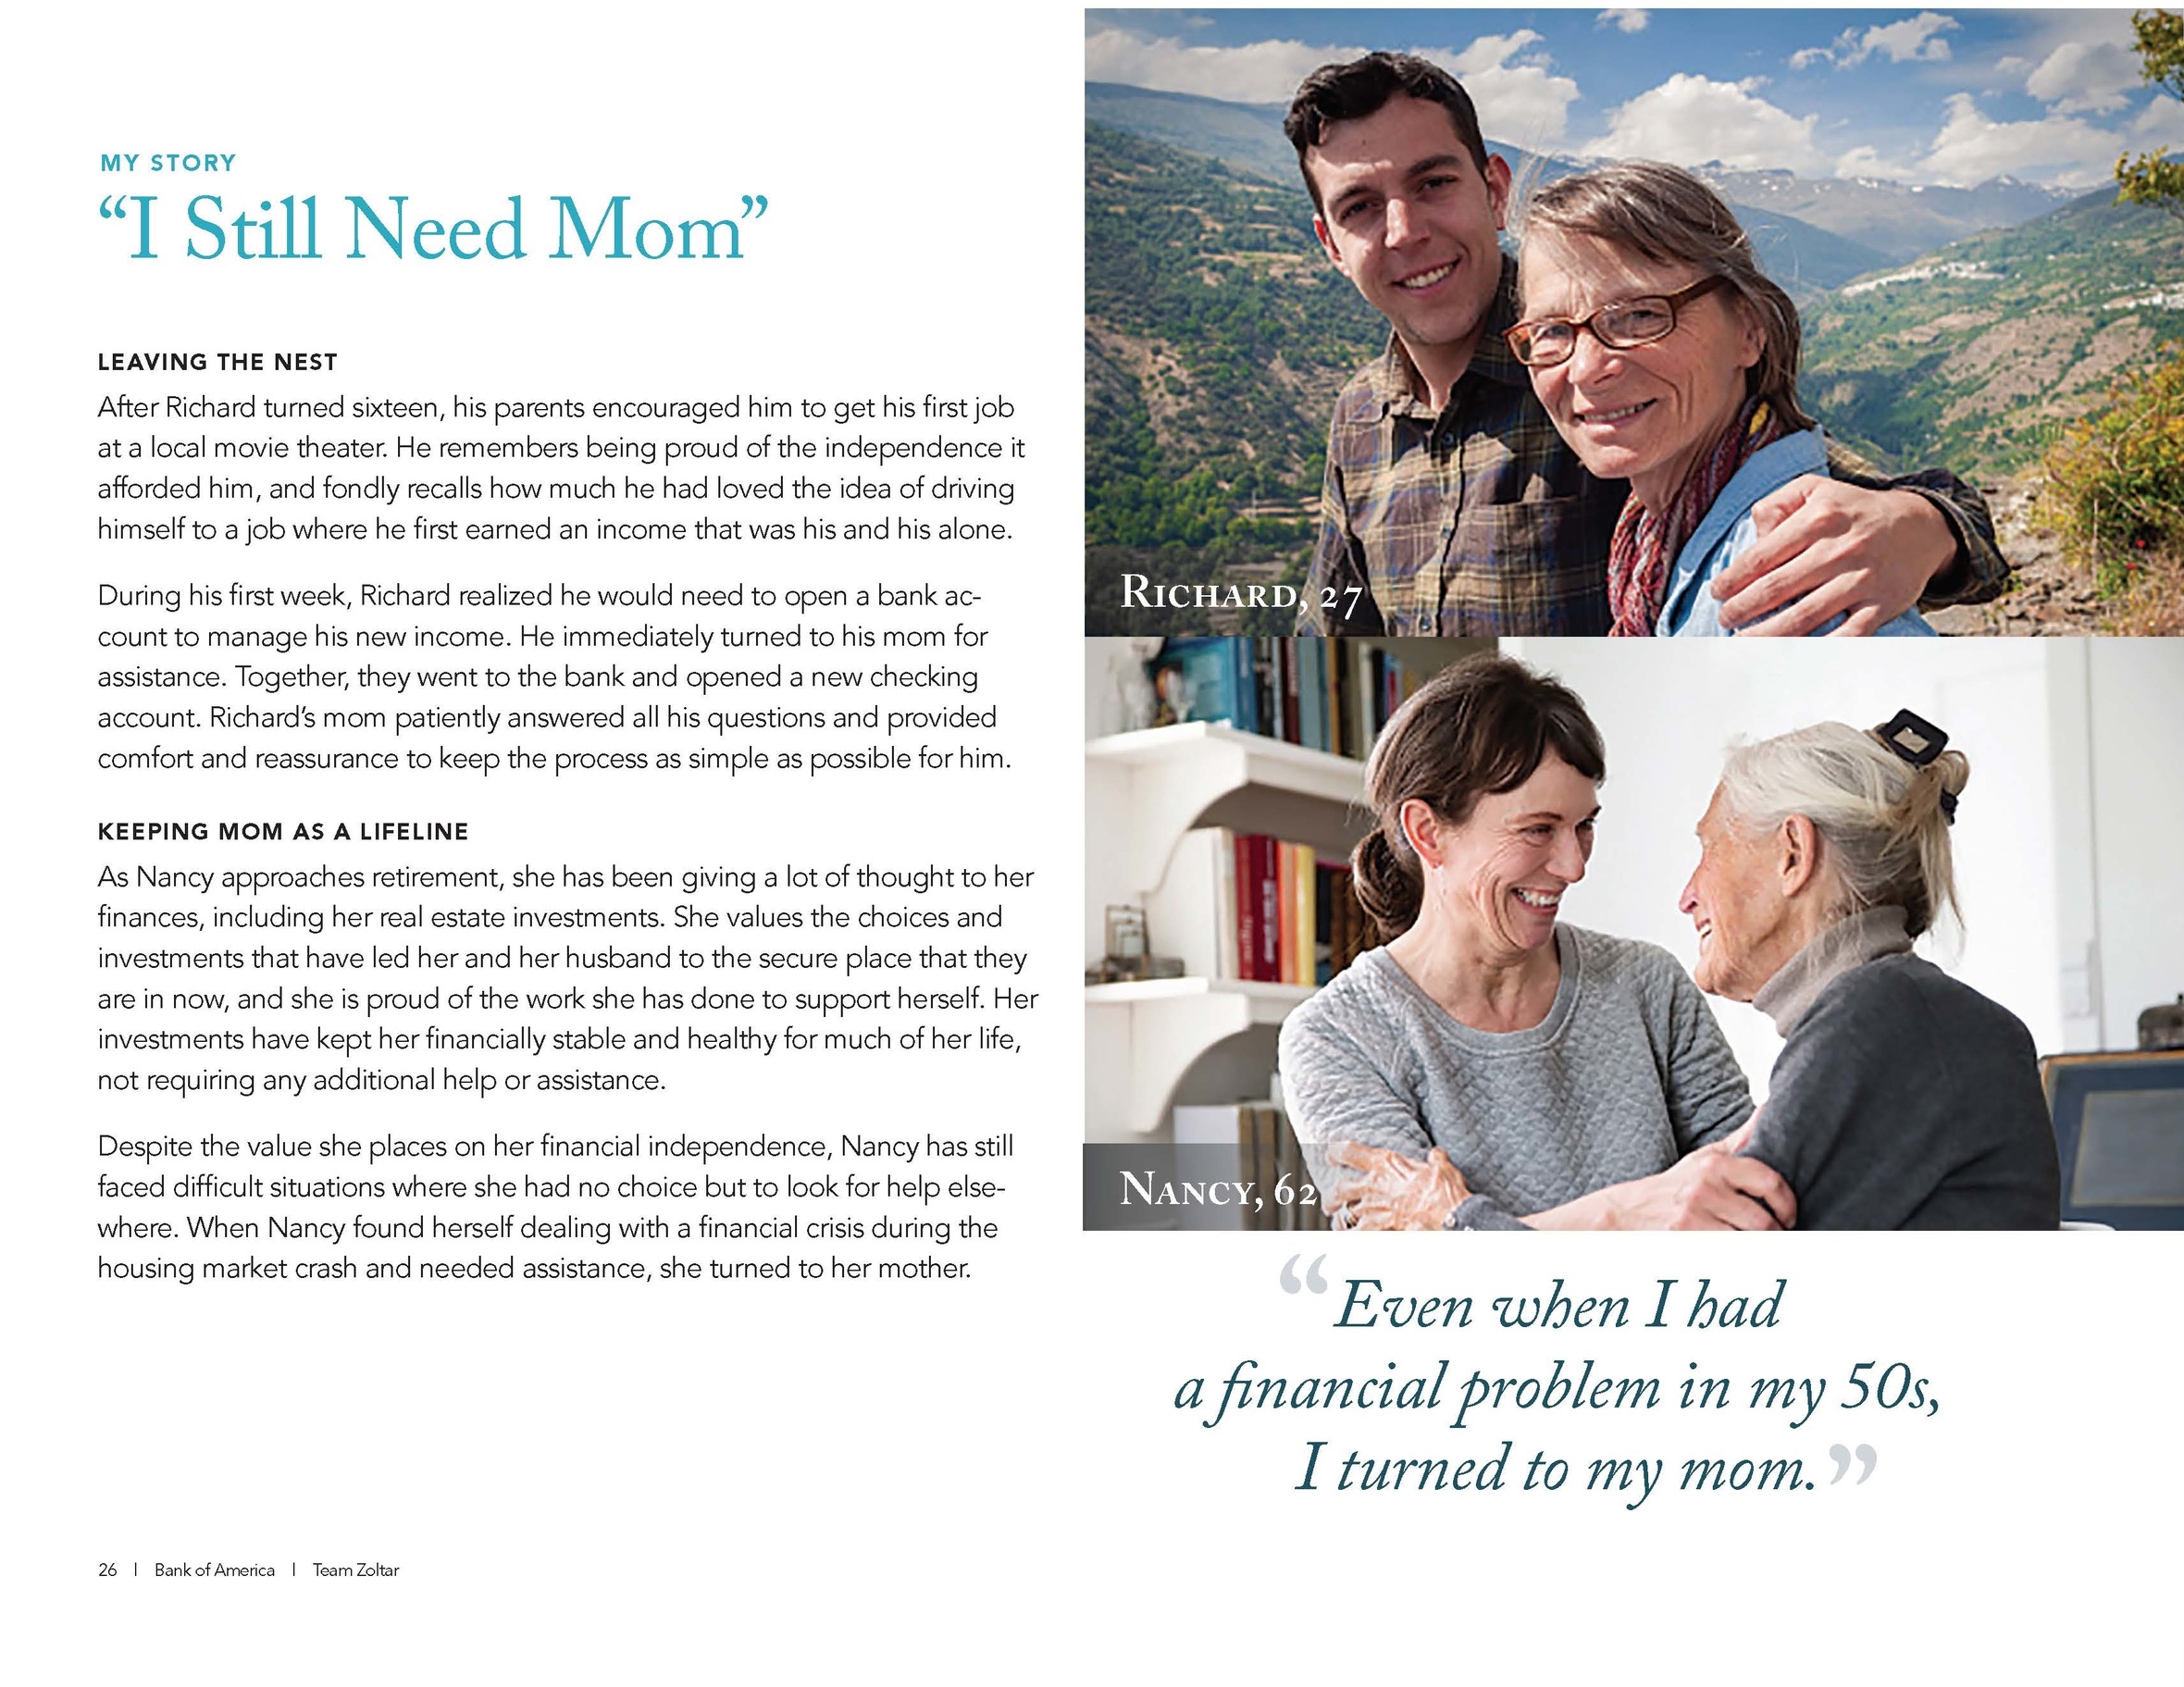
Persona Vignettes
For our clients, we put together a series of persona vignettes to illustrate our findings. These reinforced the tensions we identified and provided concrete examples to bring our findings to life.


Journey Map: Stage of Life Determines Financial Needs
Design Process Overview
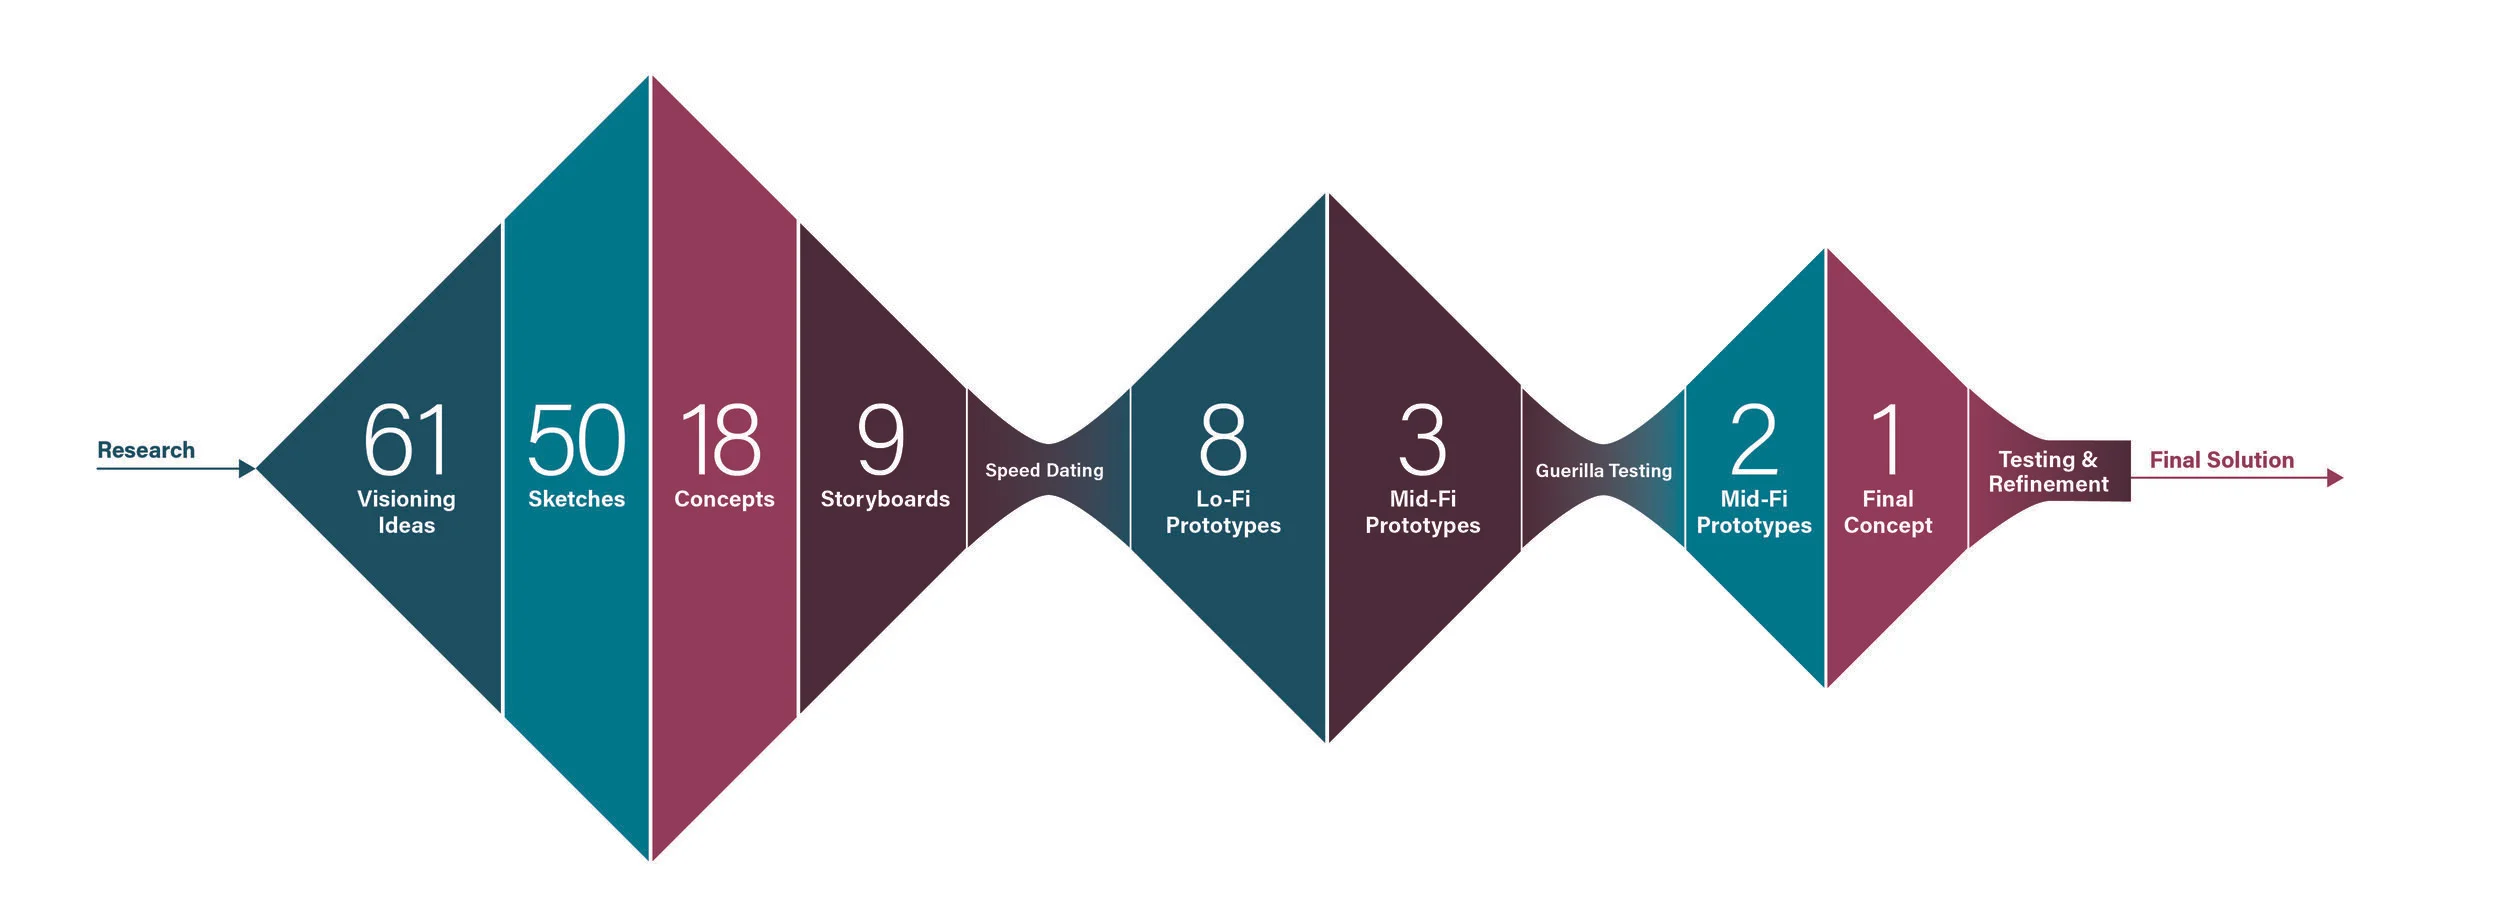
Our creation process subdivides itself into three tiers based upon the fidelity of the prototype produced: low, medium, and high. With each increase in fidelity, details become more and more crucial. During our initial low-fidelity stage, concepts were given focus over implementation, and no idea was deemed too wild or implausible. By contrast, our high-fidelity stage prioritized details and feasibility in order to create a product that could be deployed within two years.
Visioning
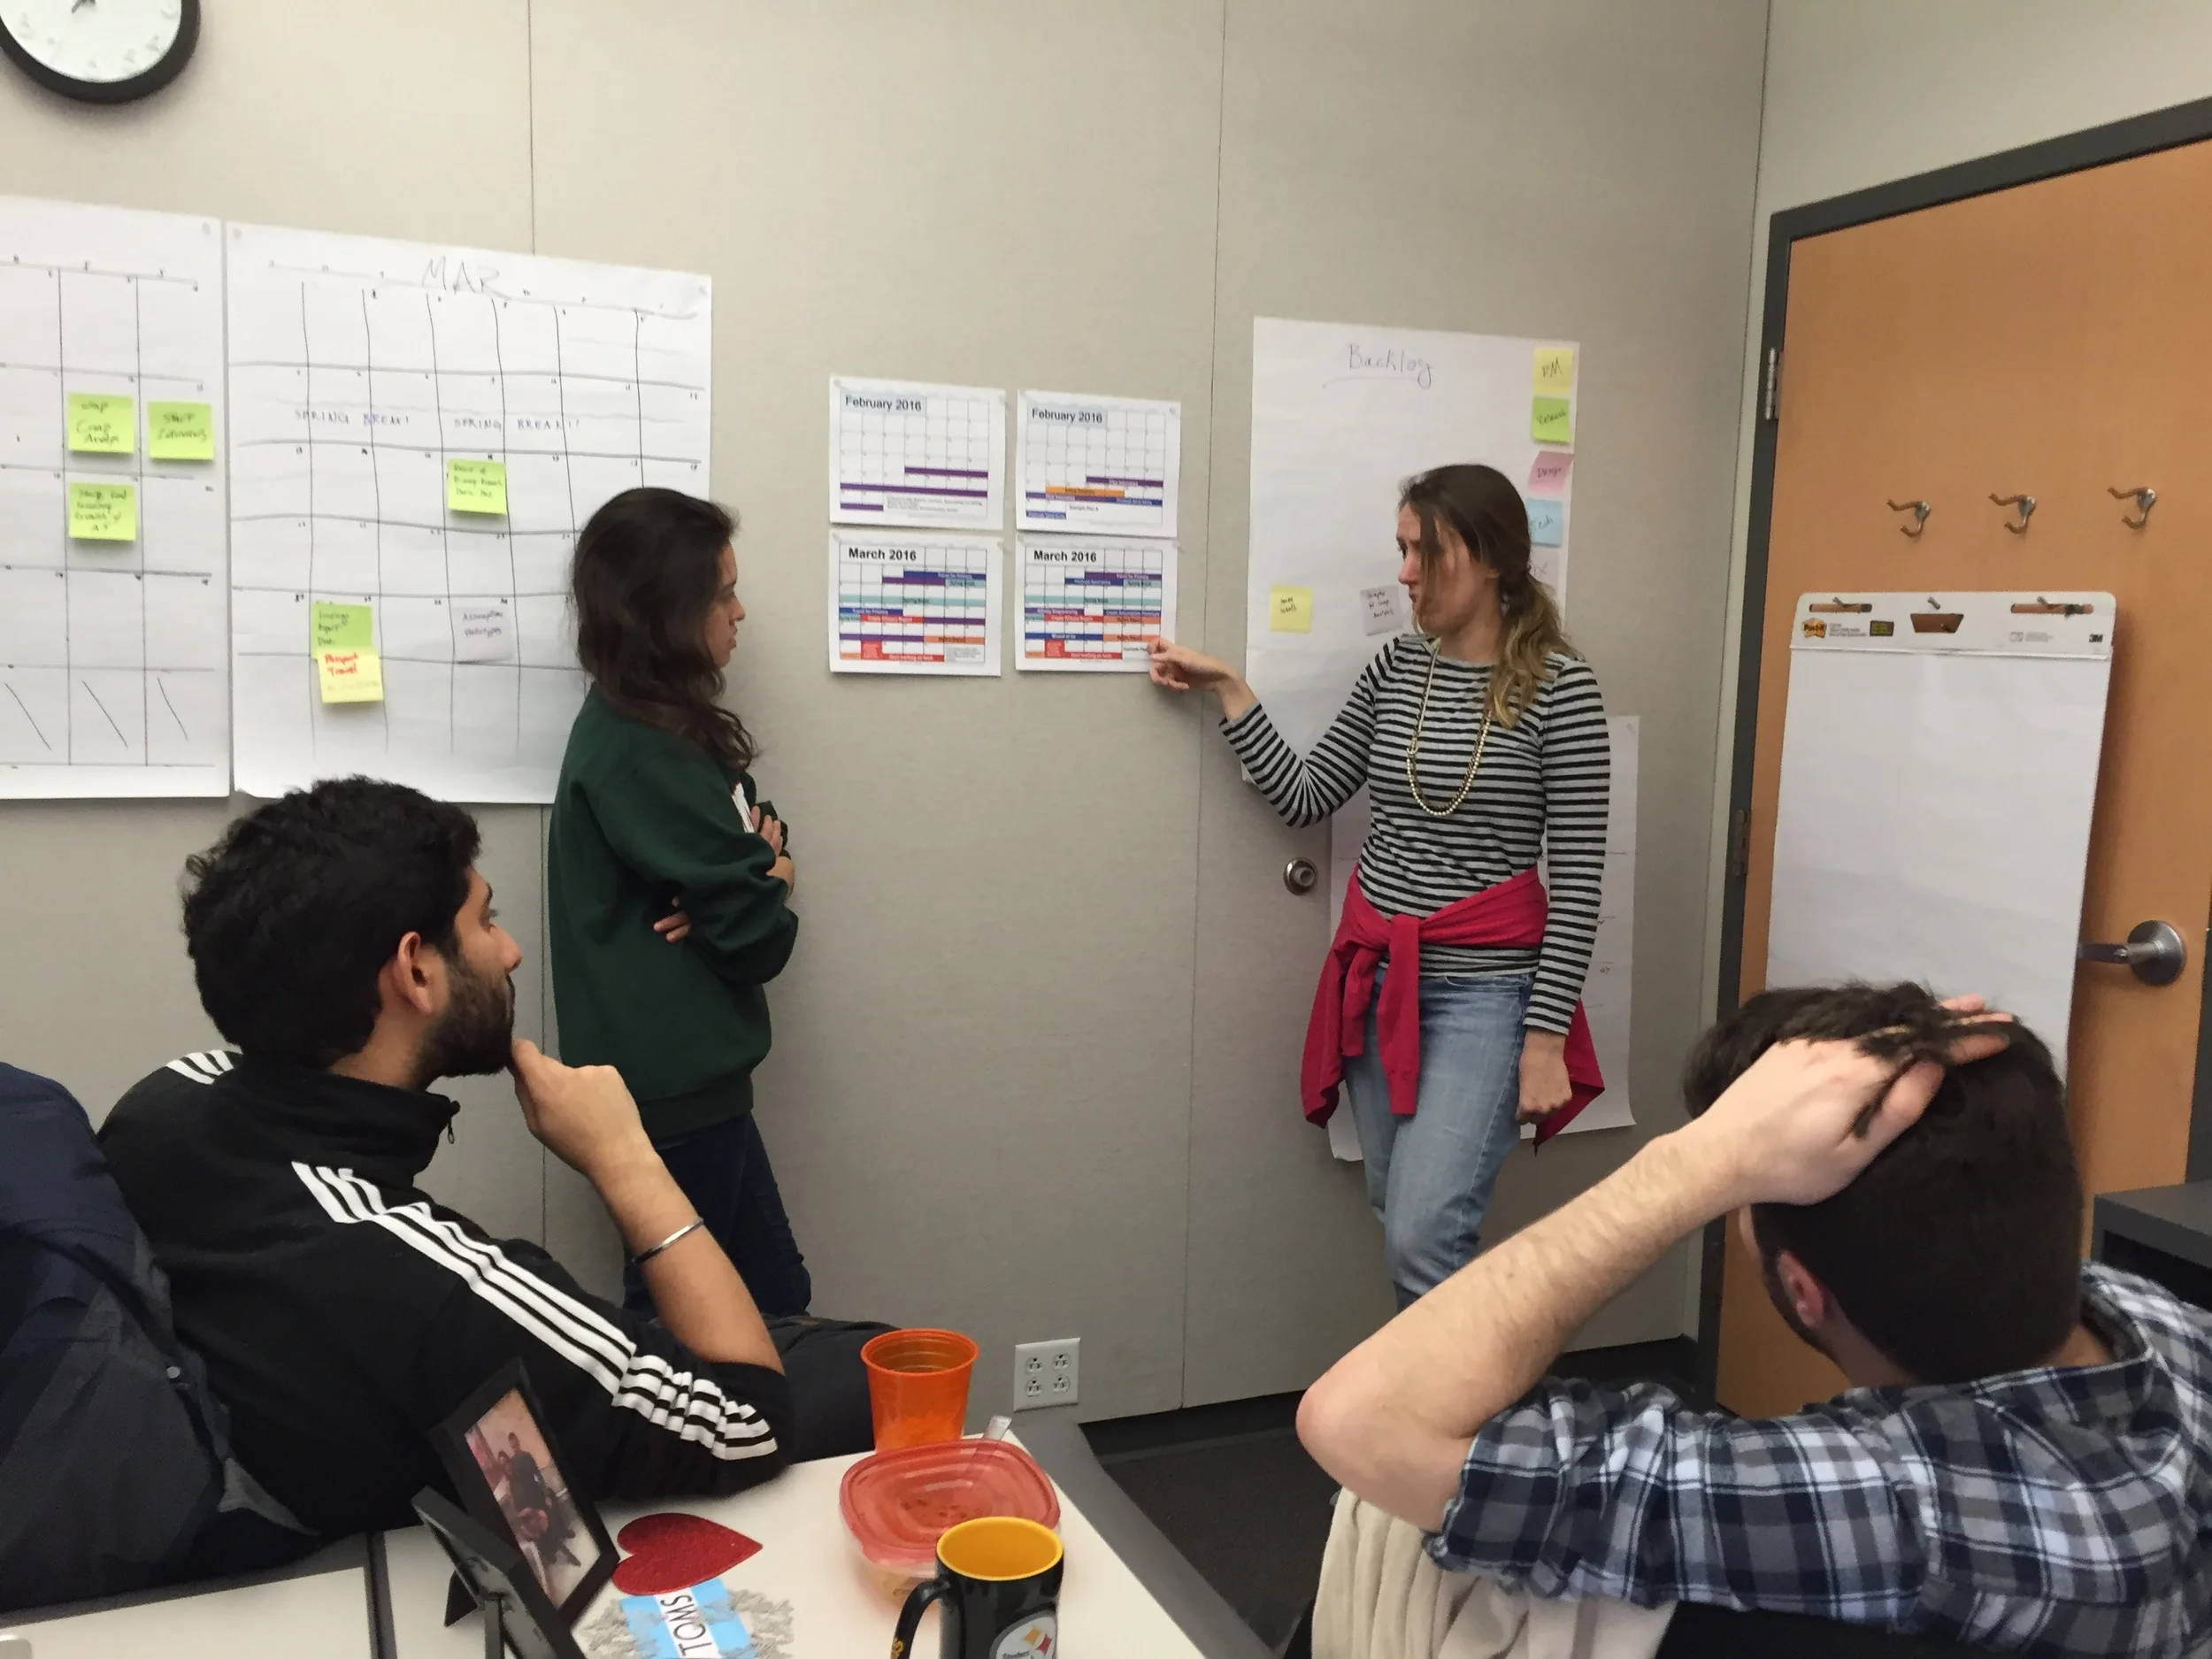
At the end of our initial user research, we began prototyping and creating with a visioning session with members of our client team.

ROUND ROBIN
Round Robin requires that each individual begin with a blank sheet of paper folded into quadrants. Each person begins by writing a definition of the problem in the first quadrant, and then passes the paper to their left. This pattern of filling out the next quadrant and passing the paper continues, with the next steps consisting of writing a solution to the initial problem, a critique of that solution, and finally a resolution to the critique.

CREATIVE MATRIX
We drew a chart where each row represented a platform (e.g. mobile, web, Internet of Things, etc.) and each column represented a group of potential users (e.g. people who prefer a hands-off approach to finances, people who are hesitant to adopt new technologies, etc.). The cross-section of a given row and column then constitutes a potential solution for that particular group using that particular platform.

DRAWING ADVERTISEMENTS
Each team member individually drew an advertisement reflecting the future to which our solution would ideally lead. These envisioned futures varied from ad to ad in specificity and time range, but all surrounded the same core ideas. The future desired was one of empathy and trust between the bank and its customers, and a simple, straightforward, and worry-free understanding of finances as a whole.
Final Design Recommendation


